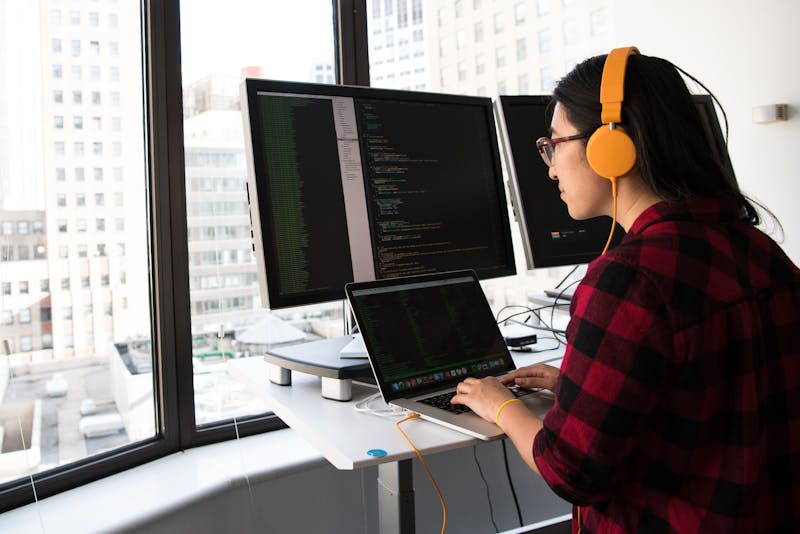
Production profiling engagement
On-call week with your repo, representative traffic or fixtures, and a written hotspot report with patch proposals.
Engagement outline →We run structured profiling sessions on your real workloads, read the flame graphs with your engineers, and land focused patches—usually within a two-week engagement window.
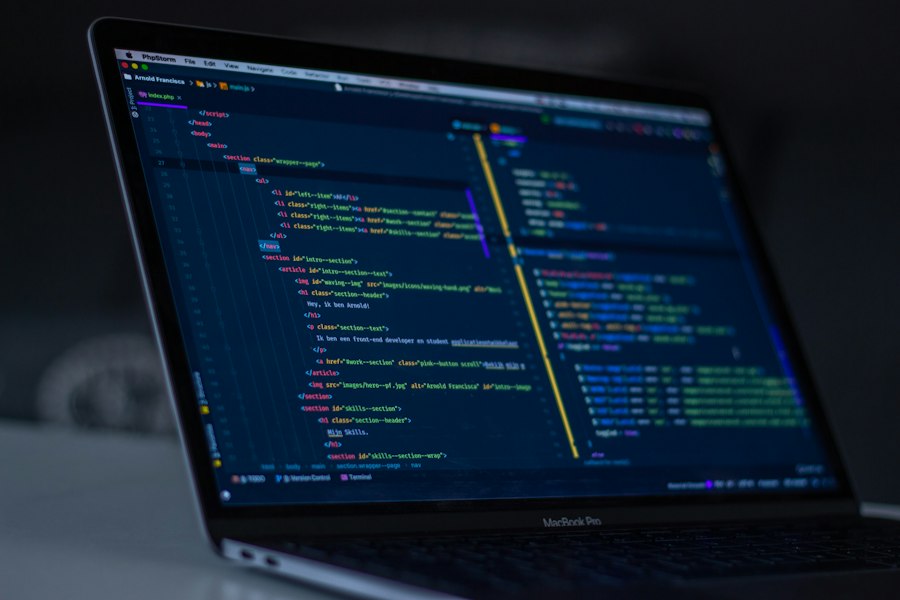
Most calls start with a latency spike, a worker that grows in RAM overnight, or a batch job that missed its window. We narrow the question before touching code.
On-call week with your repo, representative traffic or fixtures, and a written hotspot report with patch proposals.
Engagement outline →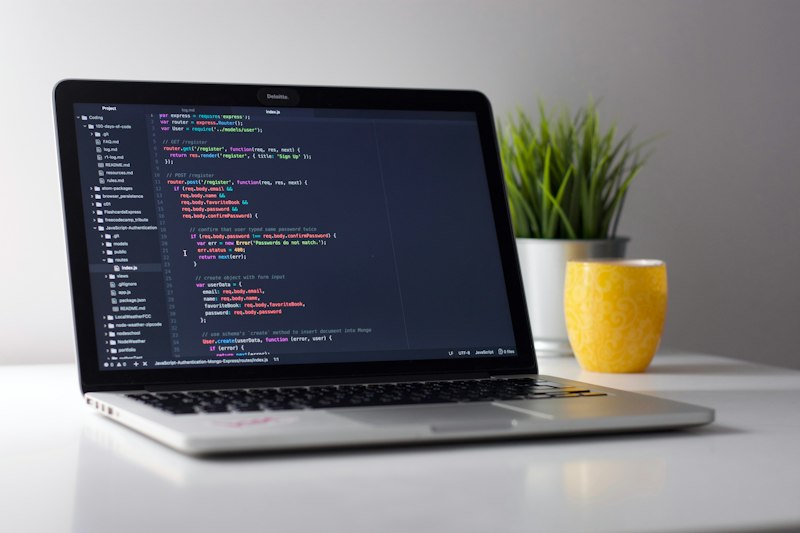
Half-day review of modules you already suspect—ORM loops, serialization, or asyncio gather patterns.
Review scope →
We join your k6 or Locust run and map failures to Python call stacks instead of guessing from dashboards alone.
What we need from you →Their Celery queue backed up every market open. We profiled one worker under recorded tasks, found a pandas concat inside a per-message loop, and replaced it with pre-allocated buffers. Queue depth returned to normal without adding hardware.
“The report named the exact SQLAlchemy loader we argued about for weeks. We still had to schedule the migration ourselves, but at least we stopped debating whether the problem was Postgres or Python.” — Lindiwe N., backend lead, logistics API (Johannesburg)
Short guides we send to clients before the first profiling session.